
Bondview's Municipal Bond Pricing Is Proven Highly Accurate
Summary:
BondView provides daily estimated fair market value prices for all 1.9 million municipal bonds. To confirm our accuracy, BondView prices were back tested over an eight year period beginning January 30 for the years 2008 through 2015. The prices were compared to the published prices of the bond portfolio holdings of the largest national municipal bond ETFs, the iShares National AMT-Free Muni Bond ETF (NYSE: MUB).
Results:
The analysis confirmed 99.45% accuracy between the two sets of about 10,000 total prices.


Introduction:
Why Daily Bond Pricing Is Required
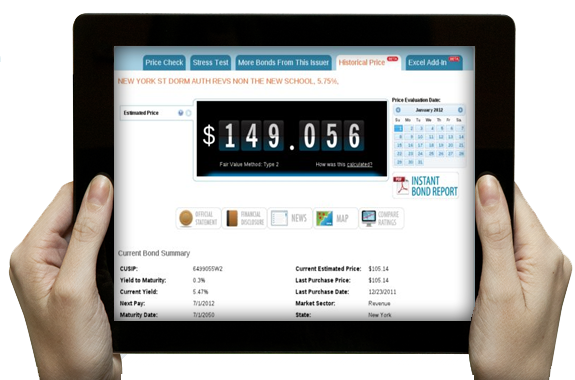
BondView was founded in 2009 to provide members of the financial industry and retail investors with accurate and objective information about municipal bonds on a daily basis. One of Bondview's primary services includes generating the daily estimated fair market value pricing of all municipal bonds. This enables traders, financial advisors and retail investors to make buy, sell, or hold decisions about individual bonds. Accountants and tax professionals also require Bondview's
historical estimated pricing data for record keeping and tax filings. Bonds, unlike stocks which are traded daily, are traded infrequently. Bonds are often not traded for months if not longer. This lack of easily available actionable pricing data is a
concern for the financial and accounting industries.
In response to this, BondView developed proprietary tools to provide the estimated fair market value prices daily for the complete municipal bond marketplace. Bondview's coverage currently extends to 1.9 million bonds and is growing daily. These tools have been perfected since BondView's inception resulting in a wide swath of the bond industry utilizing Bondview prices. The number of users requesting estimated bond prices thru Bondview's web site (www.bondview.com) has grown substantially over the years.
Bondview relies on industry best practices to evaluate a bond's fair market value by using the Financial Accounting Standards Board guidelines (Topic 820 formerly known as FASB 157). Our valuation methodology classifies bonds into Type 1, Type 2 and Type 3 according to the FASB 157 accounting standards as follows:
Type 1 Estimated fair value bond price is based on reviewing observable market prices during recent timeframes.
Type 2 For those bonds that do not have recent observable market transactions, prices are derived based upon reviewing recent trade data for similar bonds using econometric models.
Type 3 For those bonds that do not have observable inputs, prices are developed from the assessment of market participant assumptions based on the best information available under the circumstances.
Findings:
BondView Prices Are Accurate
Of course the question arises as to how accurate the prices estimated by BondView are. Pricing accuracy has been "back tested" by applying the algorithms to known trades. That is, given a buy or sell trade for a particular bond, the algorithms are then applied to determine how close the estimated price would have been to the actual traded price.
BondView's prices were compared to the published prices of the bond portfolio holdings of one of the largest national municipal bond ETFs, the iShares National AMT-Free Muni Bond ETF (NYSE: MUB).The iShares bond funds are part of a family of ETFs owned by Blackrock, a well known company.
It would be expected that iShares National AMT-Free Muni Bond ETF must also utilize price estimates of its constituent bonds, and these estimates would need to be to be highly accurate since the profitability of the ETF would depend on this accuracy. The prices used by the iShares National AMT-Free Muni Bond ETF were compared with BondView's prices over an eight year period beginning January 30 for the years 2008 through 2015. The results of this analysis showed that the two sets of prices were very similar. A total of 10,310 price points were included in the eight years of this analysis and the average difference confirmed 99.45% accuracy. The details of this analysis are described in the appendix: "Comparison of BondView and iShares MUB Pricing"
Conclusion:
What This Means For You
The pricing of municipal bonds by BondView is highly accurate. Participants in the financial services industry will take advantage of this in several ways. Most municipal bonds are traded very infrequently. Yet the financial and accounting industries need to be obtain a bond's independent and accurate fair market value. BondView enables:
- Firms that offer municipal bond funds to use daily price estimates to confirm the fund per share Net Asset value (NAV) with the underlying value of the all individual bonds in the fund.
- Portfolio managers to use daily price estimates to evaluate their performance.
- Investors to use the pricing data to make buy & sell decisions based on the movement of bond prices.
- Accountants to rely on independent historical pricing for estate tax planning.
- Bond issuers to decide at what price to issue more shares.
Appendix:
Comparison of BondView and iShares National AMT-Free Muni Bond ETF iShares Pricing
To determine how closely the price estimates of BondView and the MUB were, the January 30 prices of the bonds in the MUB were compared with the price estimates calculated by BondView for that day. This was done for the years 2008 through 2015. A summary of this analysis is shown below.
| Year | Average BondView Price | Average MUB Price | Quantity Of Bonds | Z Value | Equal Means |
|---|---|---|---|---|---|
| 2008 | 105.99 | 105.62 | 54 | 0.38 | Yes |
| 2009 | 102.77 | 103.56 | 232 | -1.74 | Yes |
| 2010 | 106.11 | 105.78 | 535 | 0.54 | Yes |
| 2011 | 101.30 | 100.65 | 1082 | 0.98 | Yes |
| 2012 | 107.38 | 109.02 | 1698 | -2.41 | No |
| 2013 | 109.78 | 109.89 | 2211 | -0.2 | Yes |
| 2014 | 105.02 | 105.49 | 2055 | -0.86 | Yes |
| 2015 | 110.06 | 110.86 | 2443 | -1.74 | Yes |
For each year the average prices of the bonds estimated by BondView and MUB were calculated and shown in the second and third columns. The fourth column shows the number of bonds in the MUB fund for that date. For each data set the total of the prices was divided by the number of bonds to get the average.
It can be seen that for each of the years the average prices are very close, all differing by less than $1, less than 1%, except for 2012. For 2012 the difference of the averages was $1.64, still only 1.5%.
A statistical test was applied to determine how closely the price estimates in each of the years matched. This test, the Z test, determines if two averages appear to be generated by the same process. The value for Z is calculated by dividing the difference of the averages and dividing by the square root of the sum of the sample variances. In this case the sample variance is the variance for the data set for that year divided by the number of samples, or bonds for that year.
To determine if the value for Z shows that the two means are identical, with a 95% confidence level, the two tail test is applied assuming the probability distribution of the difference of the averages is a normal distribution.
This assumption is generally true if the number of samples, or number of bonds in this case, is larger than 30. As can be seen in the table, the smallest sample was 54 bonds so the normality assumption would be valid.
The results were favorable with the conclusion that the two sets of prices can be considered equal with a 95% confidence level.
Disclaimer: We rely on financial data provided by 3rd parties. The data is believed to be accurate, however, Bondview makes no representation or warranty that any data or information (including but not limited to estimated pricing) supplied to or by it are complete or free from errors, omissions, or defects. You agree not to copy, modify, reformat, download, store, reproduce, reprocess, transmit or redistribute any data or information found herein or use any such data or information in a commercial enterprise without obtaining a Professional Use license. All data and information is provided "as is" for personal informational purposes only, and is not intended for trading purposes or advice. Please consult your broker or financial representative to verify pricing before executing any trade. Bondview does not provide legal, tax, accounting, or any other professional advice. This Site is intended only as an informational tool for your convenience, and should not in any way be construed as investment advice by Bondview. If you make investment decisions based on information you receive in connection with the Site, you do so at your own risk and Bondview and its employees will not be liable for any losses that you may sustain. Site users should conduct their own independent research and due diligence and obtain professional advice, if necessary, before making any investment decisions or recommendations. BondView.com gives no express or implied warranties, including, but not limited to, any warranties of merchantability or fitness for a particular purpose or use. In no event shall BondView.com be liable for any indirect, special or consequential damages in connection with subscriber's or others' use of the information provided by BondView.com.
BLACKROCK, and iSHARES are registered and unregistered trademarks of BlackRock, Inc., or its subsidiaries in the United States and elsewhere.